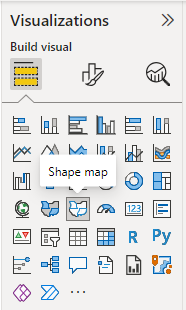
Uses of Shape Maps in Power BI
The Shape Maps feature in Power BI is not only a charting tool but also an effective method for displaying regional data insights. With the ability to create rich and powerful geographic charts, Shape Maps adds a new feature to data visualization and analysis in Power BI.
1. Uses of Shape Maps in Power BI
In creating reports using data visualization tools, illustrating data using maps has become a routine task, particularly for comparing data between regions. The simplest way to accomplish such tasks is to use Shape Maps. Unlike commonly used Maps, a Shape Map cannot display the exact geographic locations of data points on the map. Instead, its main purpose is to compare regions on a map by coloring them differently.
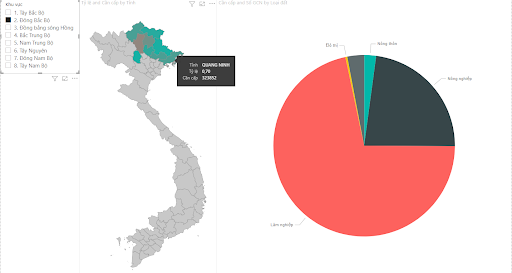
Figure 1 – Current status of land use in each region and province of Vietnam
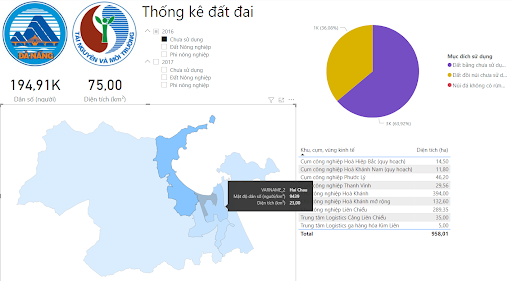
Figure 2 – Land statistics of districts in Da Nang
When moving the mouse over an area or selecting an area, the displayed descriptions, as well as other display areas of the report, also change corresponding to the selected object.
This article shares the author’s knowledge of using Shape Maps in Power BI, searching for Vietnam’s national administrative map, as well as adjusting the content, scope, and quality of the map.
2. Using Shape Map in Power BI
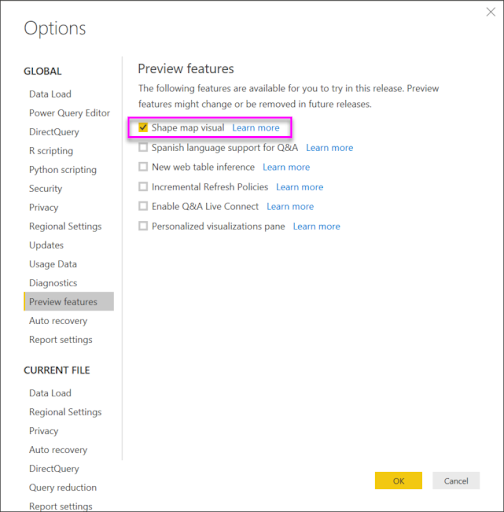
Shape Maps are not available by default in Power BI Desktop. You need to enable the feature by selecting File > Options and Settings > Options > Preview Features and selecting the Shape map visual checkbox as shown below (The order of options may vary depending on your Power BI Desktop version).
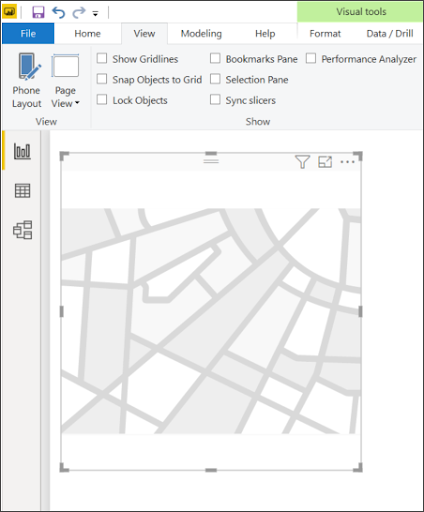
After restarting Power BI Desktop, select the Shape Map icon in the Visualizations pane as shown below.
Power BI Desktop will create an empty Shape Map.
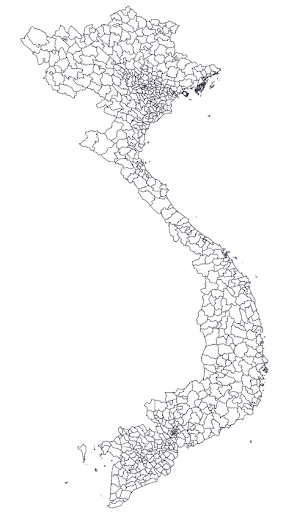
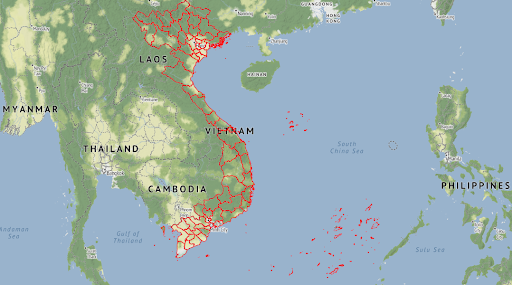
Prepare some data tables in advance to create a report. Normally, for easy viewing, we should use no more than 2 levels of administrative units in a report. For example, prepare data for regions – provinces/cities (centrally run cities), or data for districts in a city, or data for wards/communes in a district. A map with too many objects such as the following image would be difficult to understand.
After adding a Shape Map to your report, add the administrative division data from the previously prepared data table to the Location and Color saturation boxes. Once completed, select the Format for visual tab (paint brush icon) in the Visualizations pane, expand the Map settings section, select Custom map for Map type, and select + Add a map type.
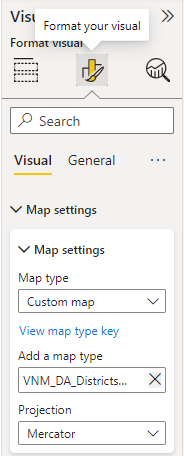
You can then click View map type key to see the names of data columns used to display the details of administrative divisions.
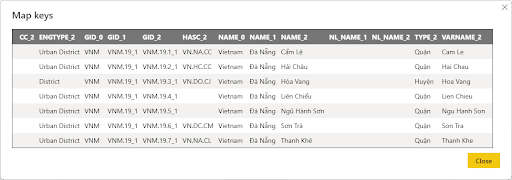
If you use the original map downloaded from https://gadm.org/download_country.html, the naming convention is as follows: use Vietnamese place name with accent marks for NAME, Vietnamese place name without accent marks for VARNAME, _0 for national level, _1 for province/centrally run city level, _2 for urban district/district level, and _3 for commune level. The administrative division columns in your reporting data table should be prepared according to this convention to ensure accurate display on the report. The data on Map keys above were used for the example in Figure 2 at the beginning of this article. Custom map of Shape Map can be used when maps are in TopoJSON format. In case your map is in a different format, you can use online tools such as Map Shaper to convert it to TopoJSON format.
3. Search for available Vietnam maps
The author’s usual source for maps is https://gadm.org/download_country.html
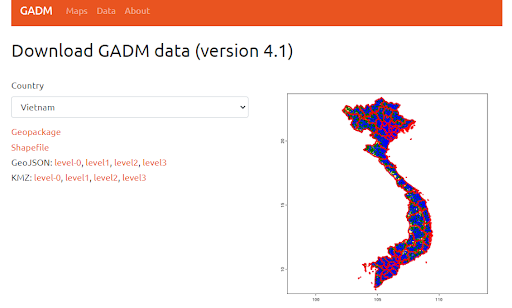
Vietnam maps from GADM offer all shape map data of national, provincial, district, and commune levels. However, Hoang Sa and Truong Sa are not included in the main map of Vietnam. Although displaying these two archipelagos has little meaning to a report, if you need them to be displayed for other reasons, you can search and download their maps using the keywords Paracel Islands (Hoang Sa) and Spratly Islands (Truong Sa). After downloading, we will have 3 files as follows:
- gadm36_VNM_shp.zip (Vietnam administrative map)
- gadm36_XPI_shp.zip (Hoang Sa map)
- gadm36_XSP_shp.zip (Truong Sa map)
You can also obtain maps from https://data.opendevelopmentmekong.net/dataset/a-phn-tnh?trk=article-ssr-frontend-pulse_little-text-block
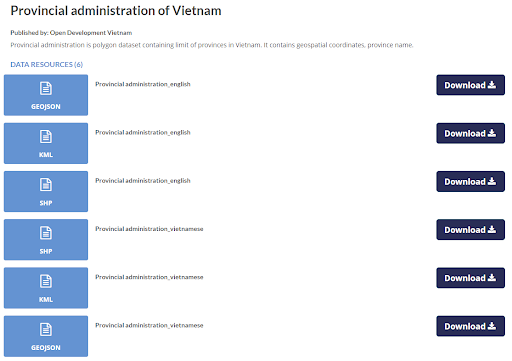
The map on this page only shows provincial administrative divisions. However, it includes Hoang Sa and Truong Sa archipelagos (adjusted for better visibility though not accurate in terms of scale).
Depending on your purposes, you can use one of the two map sources above or find other sources.
4. Use Map Shaper to filter and select maps
Open the web application, drag and drop the map downloaded from the previous step to the application screen.
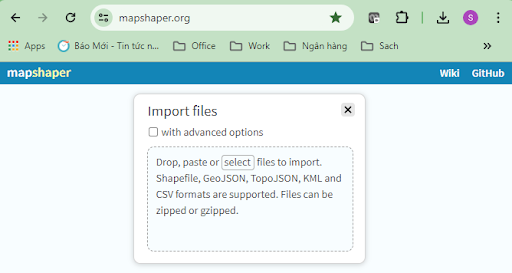
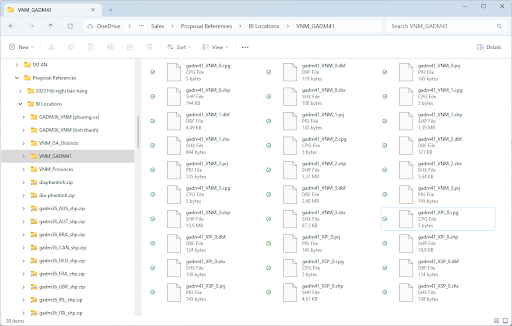
Mapshaper can work with the following data types: Shapefile, GeoJSON, TopoJSON, KLM, and CVS. Here, a shapefile file downloaded from GADM version 4.1 is used. (You can also drag and drop files in the extracted folder, or even drag and drop a whole zip file, into the Mapshaper application screen.)
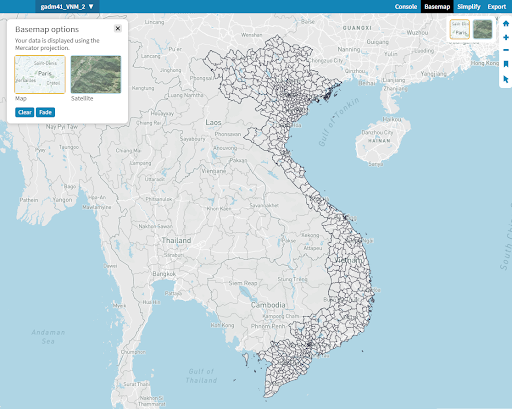
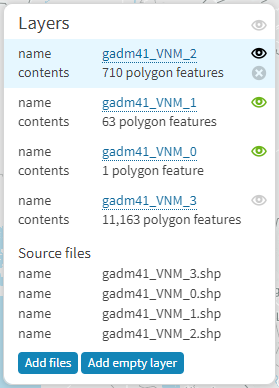
Basemap can be used to display map background images or satellite images. The Layers dialog box in the image below indicates that the second layer (including 710 polygons) is being displayed.
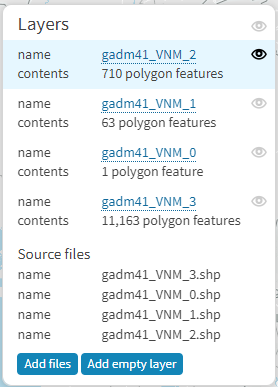
The image above also clearly shows that layer 0 includes 1 polygon which is the map of the entire country of Vietnam, layer 1 includes 63 polygons corresponding to 63 provinces/cities, layer 2 includes 710 polygons corresponding to 710 urban districts/districts, and layer 3 includes 11,163 polygons corresponding to the number of administrative divisions of ward/commune level.
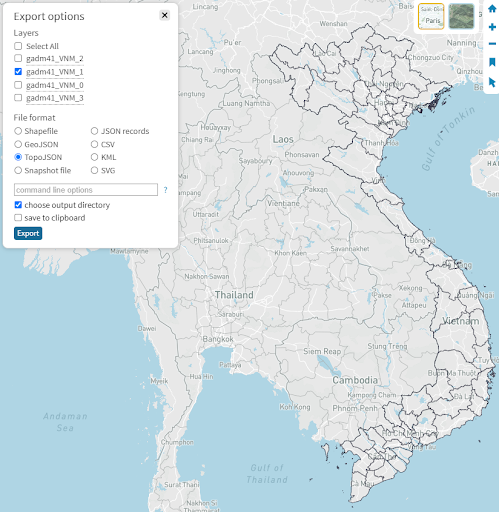
If you need a map of 63 provinces, simply Export layer 1 to TopoJSON. Click the Export button in the upper right corner of the application screen, and set some options. Your desired map will be exported.
If you need to select a range, such as districts in Da Nang city, perform the following steps:
- Open the Layers dialog box. On the dialog, click on the eye icons to the right of the layers. Single click the icon to turn the layer’s display status on/off and double click it to select the layer as the working layer so that your dialog is as shown below. There are 3 following states of the eye icon, the black icon indicating the working layer (you can view details, keep or delete objects of the layer), the blue ones indicating the displayed layers (view only), and the blurred ones indicating hidden layers. The goal of this step is to work with layer 2.
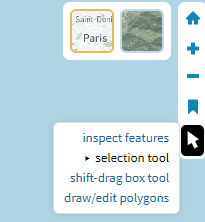
- Drag and zoom the map to the Da Nang area, press the arrow icon on the right side of the application screen and select inspect features (with a small triangle to the right). When you hover over an object (urban district/district), detailed information will be displayed in the upper left corner of the screen.

- When you select selection tool (with a small triangle to the right), the detailed description of the object is displayed similarly when selecting inspect features.
- Click to select each object (urban districts and districts) in Da Nang and then click the Keep button.
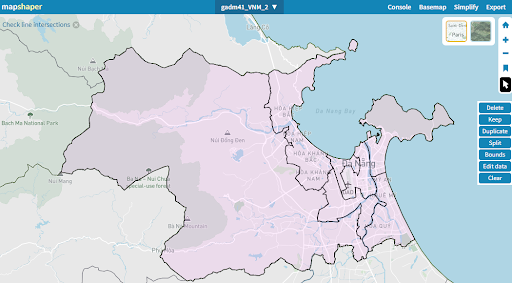
- All objects in layer 2 will be deleted except for the ones you have selected. Repeat the Export step for layer 2, you will now have a TopoJSON file of districts of Da Nang.
Use Delete command to delete the currently selected objects. Use Duplicate command to copy selected objects to a new layer (working layer). Use Split command to cut selected objects to a new layer (working layer). Use Bounds command to display the coordinates for the boundary area of the selected object group. Use Edit data command to edit detailed information of objects (in the dialog box at the top left of the application screen). Use Clear command to close the working menu for the selected objects.
After selecting the layer (working layer), you can also select Simplify to adjust the level of map detail (by sliding the slider). This command will remove some corner points of the displayed polygons, making the image smoother (similar to Zoom Out). Sometimes this function might cause some small islands to be invisible. The more you simplify the map, the smaller the TopoJSON file will be. Depending on your purpose, you should try different detail level of the map to simplify your map and reduce the file size. (In some cases, you may hardly notice any difference even when reducing the map detail level by 50%.)
In conclusion, this overview highlights the author’s practical insights and the benefits of using Shape Maps for Power BI Desktop. Shape Maps enhance the clarity and user-friendliness of reports when comparing statistical analysis data across regions. If you want to use shape maps for objects other than administrative divisions, you can use map editor software to draw and export a map to TopoJSON format.
| Exclusive article by FPT IS Expert
Author Pham Quang Son – Consulting expert, Government sector, FPT IS |